ML in Blockchain Analytics: How Models Predict Liquidations, MEV Flow, and Market Regimes
Every major DeFi protocol now sits on top of a dataset that traditional finance never had: a complete, timestamped, public record of every trade, deposit, and default. That transparency was supposed to make risk easier to see. In practice, the volume moves too fast for anyone to read manually. A liquidation cascade can start and finish in minutes. A sandwich attack executes inside a single block. A bull-to-bear regime shift can invalidate a trading model before a human analyst finishes their coffee.
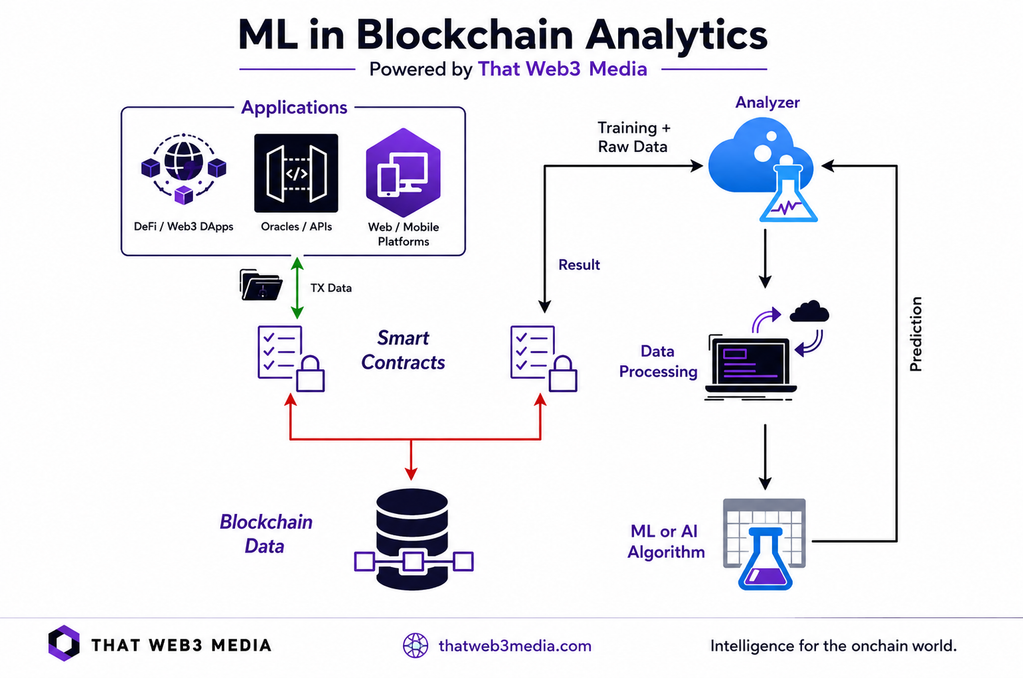
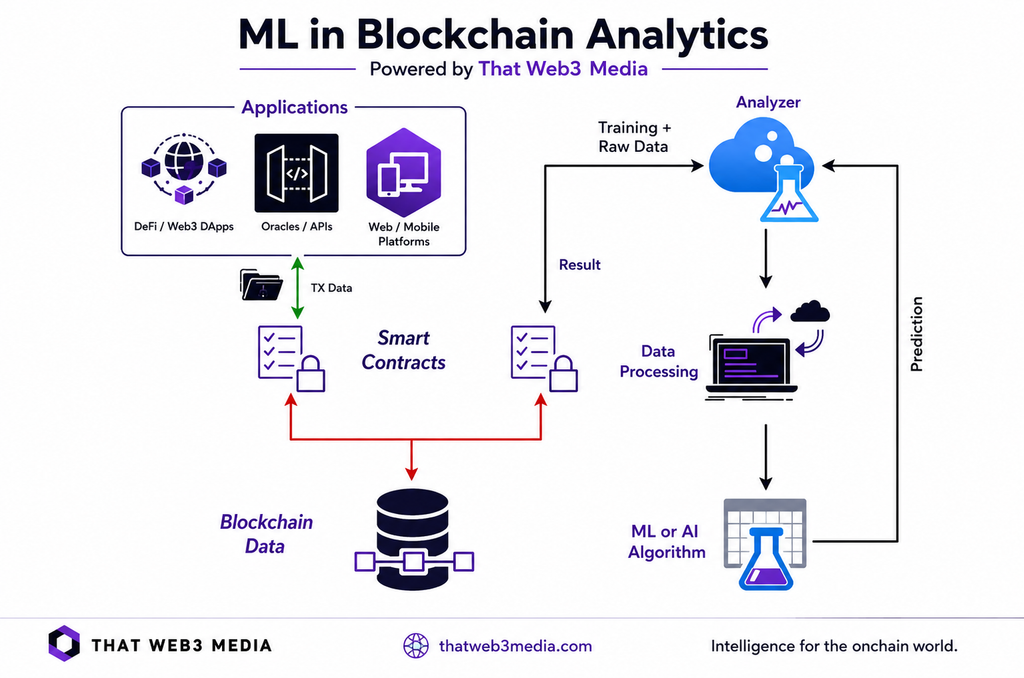
Machine learning is filling that gap. Quant teams, protocol risk desks, and MEV searchers now run models that read on-chain data the way a fraud team reads transaction logs. These models score wallets, blocks, and market conditions in real time instead of after the fact. This article breaks down what those models actually do across three domains: predicting liquidations before they cascade, mapping MEV flow as it happens, and classifying market regimes so strategies adapt instead of breaking.
What Machine Learning Is Actually Modeling in Blockchain Analytics
Blockchain analytics has always meant tracing transactions and labeling wallets. The ML layer adds something traditional analytics could not: prediction. A liquidation model does not just confirm that a wallet got liquidated. It estimates the probability that a specific wallet gets liquidated in the next six months. A sandwich-attack detector does not flag an attack after the fact. It scores a pending transaction’s risk before it lands in a block. A regime classifier does not describe yesterday’s volatility. It estimates which hidden market state the system is in right now.
These three problems share a structural advantage that traditional credit and market-risk modeling never had: every input is public and immutable. A protocol risk desk does not need a data-sharing agreement to see a wallet’s full borrowing history. A quant fund does not need a broker’s order flow to see a mempool. That transparency is why ML performs unusually well here, compared to opaque, siloed financial data.
Predicting Liquidations Before They Cascade
Liquidation prediction is the most mature of the three use cases. Lending protocols like Aave, Compound, and Maker generate clean, structured, labeled data. Every wallet’s collateral ratio, borrow history, and eventual liquidation outcome sits on-chain for anyone to model.
Academic research bears this out. A 2024 study applied gradient-boosted models to wallet-level liquidation prediction across 23 DeFi protocols and roughly 550,000 Ethereum addresses. CatBoost and LightGBM classifiers reached AUC scores of 0.847 and 0.837 on a six-month forward liquidation horizon, using 42 behavioral features drawn from deposit, borrow, repay, and withdrawal activity. More recent graph-based research published in Springer’s International Journal of Data Science and Analytics pushed that further. A hybrid model combining wallet-level features with transaction-graph relationships on Compound V2 data reached an AUC-ROC of 0.874. Its top 100 riskiest wallets, just 0.4 percent of scored addresses, accounted for every liquidation that occurred in the label period.
That last detail matters more than the headline accuracy number. A model does not need to predict every liquidation to be useful. It needs to concentrate risk into a small, watchable list so a treasury desk or protocol risk team can act before a cascade starts. This matters because enterprises still struggle with the basics of blockchain adoption long before they get to modeling this precisely. The practical features driving these models are unglamorous: health factor trajectory, deposit-to-borrow ratio changes, gas spent per transaction, and the frequency of collateral top-ups in the weeks before a position turns risky.
Mapping MEV Flow in Real Time
MEV, or maximal extractable value, is the profit a validator, builder, or searcher can capture by controlling how transactions get ordered inside a block. Sandwich attacks, arbitrage, and liquidation races all fall under it. The totals involved are no longer trivial. Flashbots’ MEV-Explore dashboard tracked over 675,000 ETH of extracted MEV on Ethereum across the years it ran. Industry trackers now put cumulative MEV across chains past the 7 billion dollar mark since 2020, with Ethereum alone accounting for roughly 550 million dollars extracted annually.
ML sits on both sides of that flow. Searchers use models that read mempool data, slippage tolerance, and pool liquidity in real time to identify profitable sandwich or arbitrage opportunities before a competing bot does. The edge is measured in milliseconds. Detection researchers use the same signals in reverse. A 2025 study on real-time sandwich detection on Ethereum’s Geth client built a system that matched results from EigenPhi’s live MEV data platform, a source widely cited across MEV research, by scoring transaction ordering, gas price patterns, and pool-specific price impact.
Graph analysis has become the dominant technique on the defensive side. Coordinated MEV extraction tends to leave a relational fingerprint: clusters of wallets, contracts, and gas-bidding patterns that repeat across attacks, which a single-transaction classifier would miss. This is also where protection has visibly worked. EigenPhi data shows monthly value extracted from Ethereum sandwich attacks fell from roughly 10 million dollars in late 2024 to around 2.5 million by late 2025, as more order flow moved through private, MEV-aware routes that ML-based routers actively steer transactions toward.
Classifying Market Regimes Instead of Reacting to Them
Crypto markets do not behave the same way in every phase. Trending, ranging, and high-volatility conditions each call for a different position size, a different stop-loss distance, and often a different strategy entirely. A model trained on one regime and deployed blindly into another tends to degrade quietly, which is a more dangerous failure mode than an obvious one.
Regime detection addresses this with a two-stage approach that has become close to standard in quant crypto research. A Hidden Markov Model first discovers latent, unobservable market states from historical return and volatility data in an unsupervised pass. A second model, often an LSTM, then learns the temporal structure of those states. It estimates which regime the market is in right now and how likely it is to shift. Recent academic research applying non-homogeneous HMMs to Bitcoin and Ether data found the approach could separate periods dominated by informed, fundamental trading from periods dominated by noise trading. Each period showed distinct short- and long-run return characteristics.
The output is not a price prediction. It is a probability distribution over hidden states, which a portfolio system uses as a risk filter. A widely referenced backtesting implementation, for instance, uses regime output to disallow new long trades and close existing ones whenever the model detects a shift into a high-volatility state. That treats regime awareness as a filter layered on top of an existing strategy, rather than a signal that replaces one.
Why On-Chain Data Is a Different Modeling Problem
Traditional financial ML competes for an information edge inside data that is expensive, delayed, or restricted. Blockchain analytics inverts that. The constraint is not access, it is volume and noise. A single Ethereum block can contain hundreds of transactions across dozens of protocols. Separating a genuine liquidation signal from routine collateral management requires heavy feature engineering before a model ever sees the data.
This shapes which architectures tend to win. Gradient-boosted tree models like XGBoost, CatBoost, and LightGBM dominate liquidation and credit-risk prediction, because tabular, engineered on-chain features respond well to them. Research comparing simpler tree models against deep neural networks has found the trees match or beat neural approaches, while training faster and staying easier to audit. That is a meaningful advantage when a risk model’s output needs to be explainable to a protocol’s governance process. MEV detection leans more on graph-based methods, since the signal often lives in relationships between wallets and contracts rather than in any single transaction. Regime detection favors sequence-aware models, precisely because market state is a function of time, not a snapshot.
What Enterprises and Protocols Should Consider Before Deploying These Models
A handful of practical decisions tend to separate ML deployments that hold up in production from ones that quietly mislead the teams relying on them.
Label quality over model complexity. A liquidation or MEV label is only as good as the on-chain event it is tied to. Sloppy labeling, such as counting a partial liquidation the same as a full one, degrades a model’s usefulness far more than switching algorithms would.
Explainability for governance and compliance. Protocol risk parameters and treasury decisions increasingly get reviewed by governance votes or regulators. A model that cannot show which features drove a risk score is a harder sell than a slightly less accurate one that can.
Concentration over coverage. As the Compound V2 research shows, a model does not need to catch every liquidation to be valuable. A short, high-confidence watchlist that a risk team can actually act on beats a broad, noisy one nobody has time to review.
Latency budgets that match the use case. A regime classifier can run on daily or hourly data. A sandwich-attack detector has to score a transaction before the next block. That difference changes the entire engineering stack, model size, and infrastructure choice involved.
Adversarial adaptation. MEV searchers and sandwich bots actively adapt to detection methods. A defensive model trained once and left alone will decay as attackers route around its blind spots. That makes retraining cadence a governance decision, not just an engineering one.
The Road Ahead
None of these three domains, liquidation prediction, MEV mapping, or regime detection, are replacing human risk judgment. What they are doing is compressing the time between a risk forming and a risk being visible. That window has shrunk from days of manual review down to the length of a block. This compression is what makes the technology genuinely useful, rather than a novelty layered on top of existing dashboards.
The harder open question is not modeling accuracy. It is who gets access to these signals, and how fast. A protocol’s own risk team running a liquidation model internally is a defensive tool. The same model, sold as a signal feed to searchers, becomes an offensive one. On-chain ML will keep maturing through 2026 and beyond. The protocols and enterprises that treat these models as infrastructure, integrated into governance, risk limits, and audit trails, will likely get more durable value from them than those chasing the highest AUC score in isolation.
Frequently Asked Questions
What data do liquidation prediction models actually use? Most models rely on wallet-level behavioral features drawn from on-chain history: collateral ratio trends, deposit and repay frequency, borrow-to-deposit ratios, and gas spending patterns. Many combine these with graph-based features that capture how a wallet’s transaction relationships compare to already-liquidated wallets.
Can machine learning stop MEV attacks entirely? No. ML is effective as a monitoring and detection layer, identifying sandwich attacks, front-running, and coordinated bot activity as they happen. It works alongside structural fixes like private mempools and MEV-aware transaction routing, rather than replacing them.
How is market regime detection different from a price prediction model? A regime model does not forecast price. It estimates which hidden market condition, trending, ranging, or high-volatility, is most likely active right now. That output is typically used as a risk filter layered on top of an existing trading strategy, rather than a standalone signal.
Why do gradient-boosted trees outperform deep learning for a lot of on-chain risk modeling? On-chain risk data is largely tabular and heavily feature-engineered, rather than raw sequential or image data. That is the setting where tree-based models like XGBoost and CatBoost tend to match or beat neural networks while also training faster and staying easier to explain to governance and compliance stakeholders.